

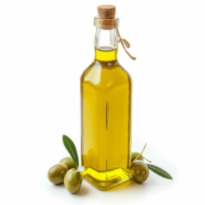
Custom Consumer Report – Olive Oil
Most published market reports on olive oil focus on industry parameters such as market size, growth, shares and trends. They provide a useful bird’s eye overview of general market performance. However, because the publishers typically compile these reports from relatively few interviews with industry observers and from available market statistics, they do not offer much marketing insight into consumer dynamics.
More actionable is to gain an understanding of the attitudes consumers adopt about the different grades of olive oil, how they compare with other edible oils, their purpose of use, the connection they have with brands and how much they spend on them, including market share estimates. In other words, knowledge of consumer opinions and behaviour.
Against this backdrop, we are preparing a multi-country consumer survey on olive oil, but one with a difference. The questionnaire will consist of a core section covering a standard set of key topics that drive consumer dynamics for general reporting. However, you have the option to include your own questions on issues that are pertinent to your marketing decisions. These questions are completely customised to your needs, could be on any topic with results exclusive to you.
We run the survey as often as there is demand for it, expecting this to be at least once a year. The first is planned for Q2 2025.
Request More Info
Description
Core Section
- What types of vegetable oil do consumers choose by purpose of use? What criteria do they adopt in this selection process?
- Which qualities in olive oil are important to consumers, for example, flavour, aroma, health benefits – which?
- What are the substitutes (if any) for olive oil (e.g., canola, sesame, sunflower) by purpose of use, reasons, and how do consumers experience them compared with olive oil.
- Understanding of the differences in types of olive oil, for example EVOO, Virgin, Pure/Regular, Light/Extra Light.
- What are the selection criteria consumers adopt when choosing between brands of olive oil and how do they vary by grade? Including qualities such as organic, flavoured, packaging solution (e.g. ecofriendly).
- How do consumers determine the quality of the olive oil they buy? For example, brand assurance, label information (including production date), country of origin, recommendations (e.g. word of mouth, social media), internet searches etc.
- For what purpose do consumers use the different grades of olive oil?
- How often do households buy olive oil by grade and by size of bottle/container?
- Which brand of olive oil did they buy on the last purchase occasion by grade and size. What was the source of purchase (e.g., supermarket, convenience store, online)?
- What was the retail price for the olive oil (by type) they bought on that last occasion?
- Market shares in volume and value by brand, container size and source of purchase.
- To which below and above the line marketing/merchandising activities are consumers receptive? For example, POS displays, discounts and other promotions.
- How brand-loyal are olive oil buyers and which criteria tempt them to stray to other brands?
- Perception on the value for money by olive oil grade. At what relative price point will consumers switch to another grade? What is the likely impact of the “Trump tariffs” in the US?
- Identify need-gaps for innovation.
- Demographic and lifestyle questions for the purpose of analysis.
Exclusive Customisable Section
Here the sky is the limit. Some examples…
- Brand awareness (top of mind, spontaneous).
- Brand image.
- Brand disposition (ranging from rejection to insistence).
- Brand selection criteria by grade.
- Sources of brand awareness (e.g., traditional media, social media, POS, word of mouth, internet searches).
- Price sensitivity. At what relative price point will consumers switch to another brand in the same or in a different grade?
Fees for Core Report by Country
| Country | Sample | Core Price (USD) |
|---|---|---|
| Albania | 200 | US$ 2,320 |
| Algeria | 200 | US$ 3,940 |
| Australia | 350 | US$ 3,485 |
| Belgium | 300 | US$ 3,910 |
| Brazil | 450 | US$ 3,760 |
| Canada | 400 | US$ 3,660 |
| Croatia | 300 | US$ 2,485 |
| Cyprus | 250 | US$ 3,075 |
| Denmark | 300 | US$ 3,910 |
| France | 500 | US$ 3,675 |
| Greece | 500 | US$ 2,575 |
| Ireland | 300 | US$ 3,240 |
| Israel | 300 | US$ 3,430 |
| Italy | 500 | US$ 3,975 |
| Jordan | 200 | US$ 3,940 |
| Lebanon | 250 | US$ 3,950 |
| Libya | 200 | US$ 3,150 |
| Luxembourg | 200 | US$ 2,660 |
| Malta | 200 | US$ 2,660 |
| Morocco | 400 | US$ 3,560 |
| New Zealand | 300 | US$ 3,510 |
| Portugal | 500 | US$ 3,075 |
| Spain | 500 | US$ 3,200 |
| Sweden | 300 | US$ 3,880 |
| Switzerland | 200 | US$ 3,760 |
| Tunisia | 200 | US$ 3,940 |
| Turkey | 500 | US$ 2,875 |
| United Kingdom | 400 | US$ 3,100 |
| United States | 800 | US$ 2,820 |
Multi-country discounts are:
- 5% for two countries.
- 8% for three to five countries.
- 12% for more than five countries.
Fee per Customised Question
- A flat rate per question, which is the same for all countries.
- Maximum number of columns in a matrix question is 8 and maximum number of rows for multiple-answer questions is 15.
- The rates below are per country.
| Question Type | Description | US$ Each |
|---|---|---|
| Single answer question | One answer out of a list | US$ 85 |
| Multiple answers | Can select more than one answer from a list | US$ 105 |
| Matrix question | Multiple atributes and answers in columns and rows | US$ 125 |
| Scale/slider/ranking | Rating or ranking of a series of attributes or images | US$ 115 |
| Open-ended question | Text field for entering answer | US$ 125 |
Data Collection and Reporting
Methodology
- Respondents make the decision or have a key influence on the purchase of olive oil for the household.
- The sample aims to represent the population of households buying olive oil in terms of age, socio-economic group and household size.
- The survey engages respondents through a consumer panel and social media.
- Respondents complete an online questionnaire in their own language, which will take them around 20 minutes.
- Digital fingerprinting and GPS authentication prevent duplication of respondents.
Reporting
- The report will be in PowerPoint format.
- The structure of the report:
- Introduction.
- Description of methodology including statistical significance indicators.
- Executive summary with recommendations derived from customised questions.
- The main body of the report consists for findings from each question, presented in a logical flow.
- Appended to the report is an Excel file containing the data tables and graphs included in the report.
- The report will be available after 15 days of launching fieldwork.